
the outcome
- Charts that are presentation-ready by default
- Saved views and one-click sharing
- A consistent visual language for every metric
Platform & Dashboard Design
An analytics dashboard that turns dense product data into clear, shareable answers.
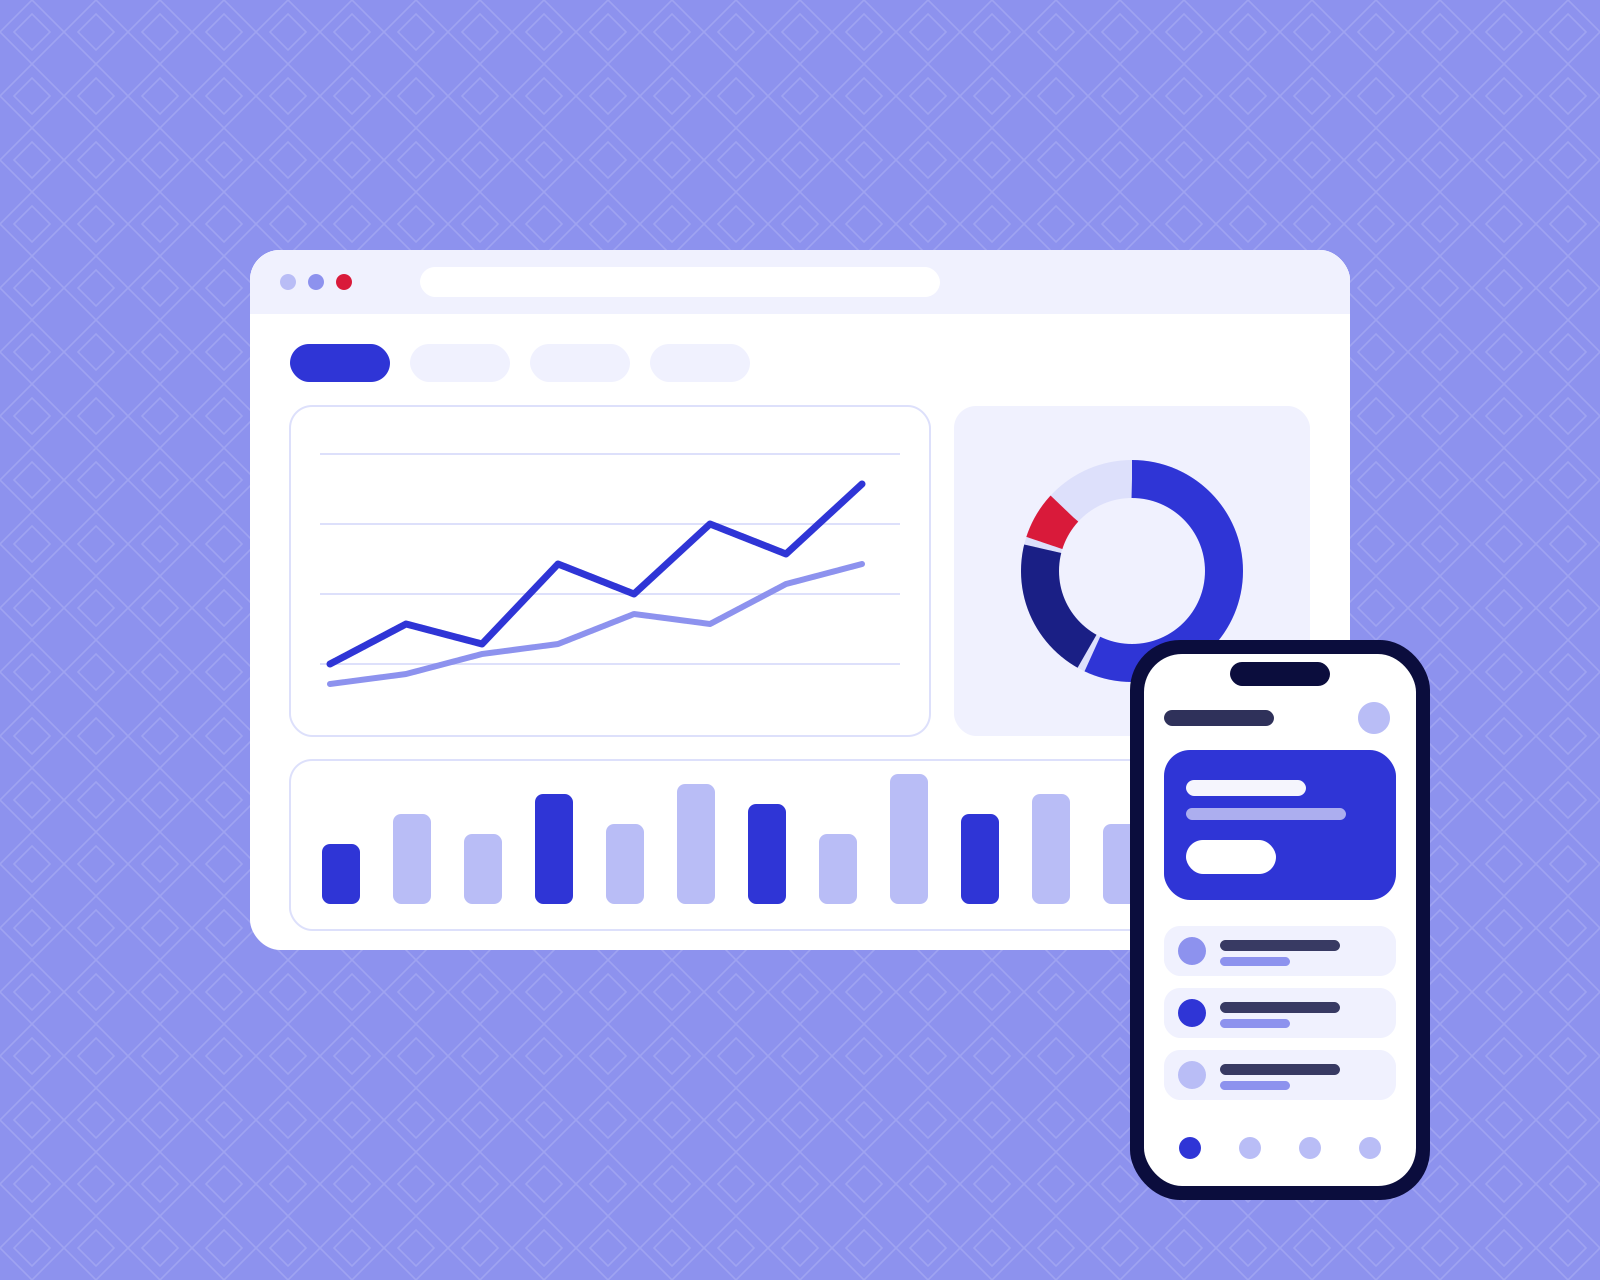
The old dashboard showed everything and explained nothing. Analysts exported to spreadsheets just to build a chart they could present.
We reduced each view to the questions people actually ask, designed a restrained chart language and added one-click sharing, so an insight can leave the tool as cleanly as it was found.